
Monitoring Azure Sentinel data connectors health is crucial to keep your environment secure. There are many different angles in this topic, and I’m only scratching the surface in this blogs post where I cover how to use native Azure Sentinel workbooks and one use case: “admin activity – detecting data connector deletion”.
I often receive question related to Azure Sentinel data connector monitoring from the field, and there are naturally different views how monitoring should be handled. For example, do I use Azure Sentinel Analytics Rules or do I use Azure Monitor? Do I want to have data connector alerts be on the same view than incident? There might be different teams for handling platform and application level and so on.
Available Tools
- Native Workbooks
- Data Collection Health
- Workspace Usage Report
- KQL queries based on Azure Activity data
- Data Connector Health – Push Notification Alerts
Workbooks
Data Collection Health Monitoring Workbook
Data Collection Health workbook provides deep insights of underlying Azure Log Analytics. The Overview tab shows the general status of data ingestion in the selected workspace: volume measures, EPS rates and time last log received. I have used overview tab for confirming information such as:
- Table size
- Table entries
- Table cost status (billable/free)

The workbook has other related information such as data collection anomalies and agents info.
When to use
When you want to identify overall situation of the workspace and when the latest data has been saved to the Log Analytics tables. Also, data collection anomalies and agents info contain valuable information from data collection process and VM availability which can be used to detect possible changes in the data ingestion baseline.
Microsoft has published example Logic App Playbook to send data ingestion anomalies data via email & Teams channel.

Workspace Usage Report
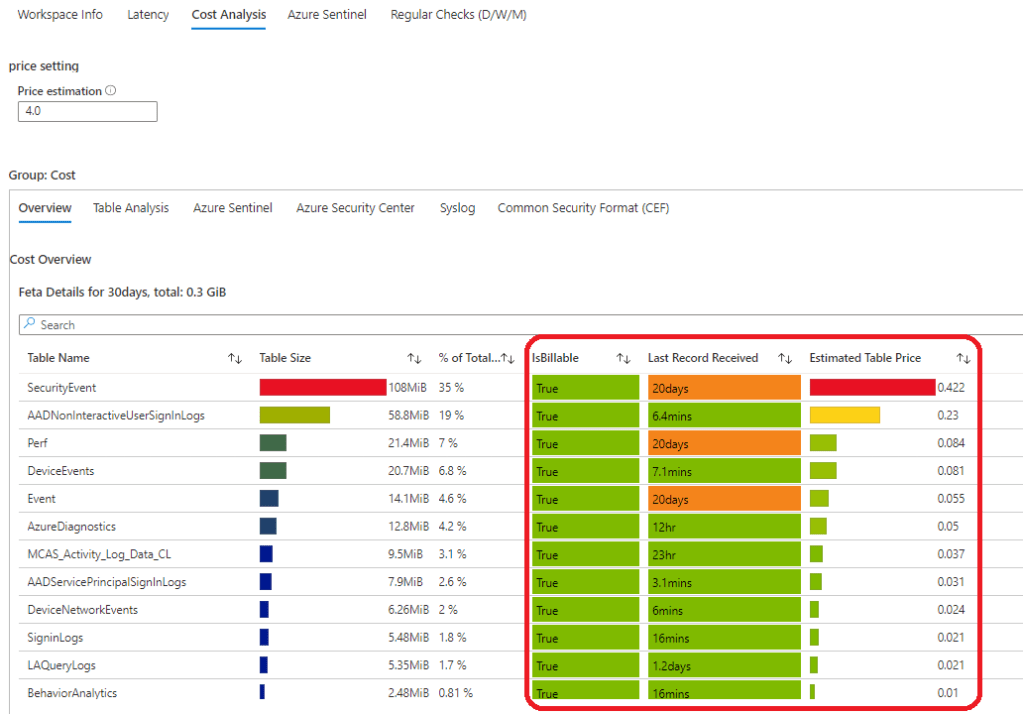
This workbook contains some overlapping information about the table but have richer information in general. The last three (3) columns contains very useful information from the data connectors monitoring point of view. The workbook has bunch of other queries that I’m not going to cover in here but I encourage to test it yourself.
The ‘Last Record Received’ is extremely interesting here.
union withsource=TableName1 *
| where TimeGenerated > ago(30d)
| summarize Entries = count(), Size = sum(_BilledSize), last_log = datetime_diff("second", now(), max(TimeGenerated)), estimate  = sumif(_BilledSize, _IsBillable == true)  by TableName1, _IsBillable
| project ['Table Name'] = TableName1, ['Table Size'] = Size, ['Table Entries'] = Entries,
    ['Size per Entry'] = 1.0 * Size / Entries, ['IsBillable'] = _IsBillable, ['Last Record Received'] =  last_log, ['Estimated Table Price'] =  (estimate / (1024 * 1024 * 1024)) * 4.0
| order by ['Table Size']  desc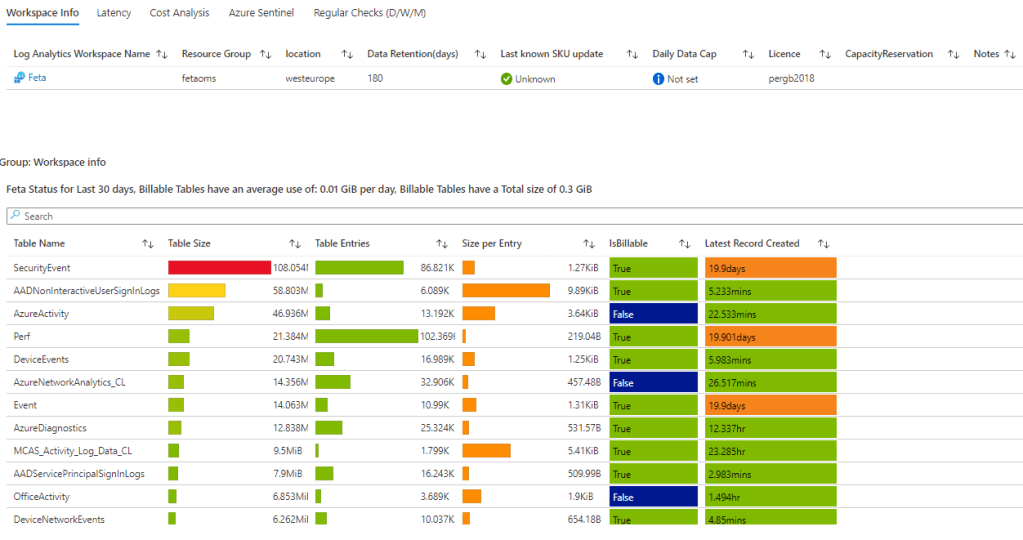


When to Use
The workbook has lots of information from the workspace activity such as detailed information about the tables, latencies, cost analysis and Azure Sentinel related data types & other relevant information. Extremely valuable workbook that can be used for analyzing Azure Sentinel & Log Analytics workspace status.
Admin Activity – Detecting Data Connector Delete Action
Resource Provider
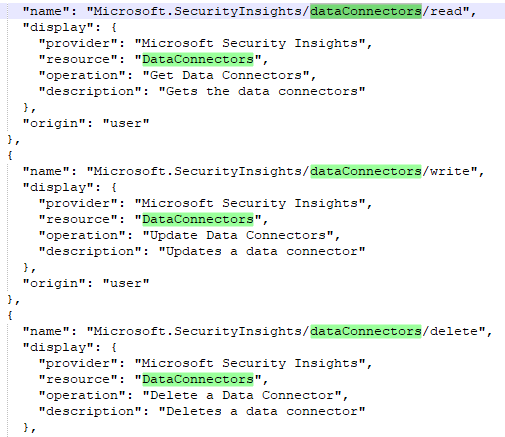
Operative activities for dataconnectors are written to Azure Activity Log by Microsoft.SecurityInsights resource provider. With the following REST API call you can query all the operations by the provider:
GET https://management.azure.com/providers/Microsoft.SecurityInsights/operations?api-version=2020-01-01Operations are
- Dataconnectors/read
- DataConnectors/write
- DataConnectors/delete
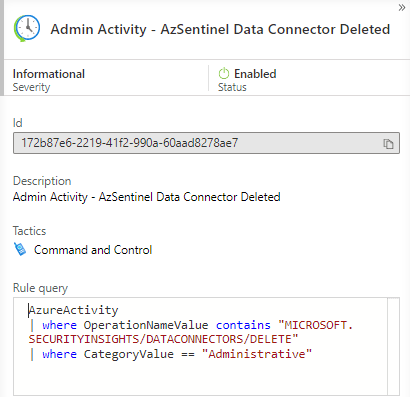
Detecting Data Connector Delete Action
That leads us to the actual use case – “Detecting Data Connector Delete Action”. If someone deletes a data connector from Azure Sentinel the activity is written to Azure Activity Log.
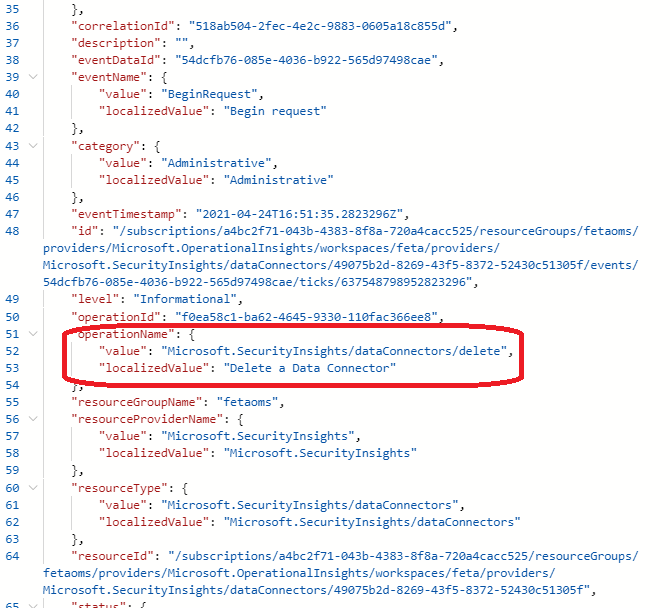
Found from Activity Log, it’s easily found from Log Analytics if data is ingested to there. The following query works as a starting point for creating informative rule to Azure Sentinel instance or to Azure Monitor.
AzureActivity
| where OperationNameValue contains "MICROSOFT.SECURITYINSIGHTS/DATACONNECTORS/DELETE"
| where CategoryValue == "Administrative"
Detecting Data Connector Change Action
Same with the possible data connector change.
AzureActivity
| where Category contains "Administrative"
| where ResourceProvider == "Microsoft.SecurityInsights"
| where OperationName == "Update Data Connector"
Alerting of Previous Actions
Sentinel
Create Azure Sentinel Analytics rule based on your environment needs. When activity is detected an incident is created.

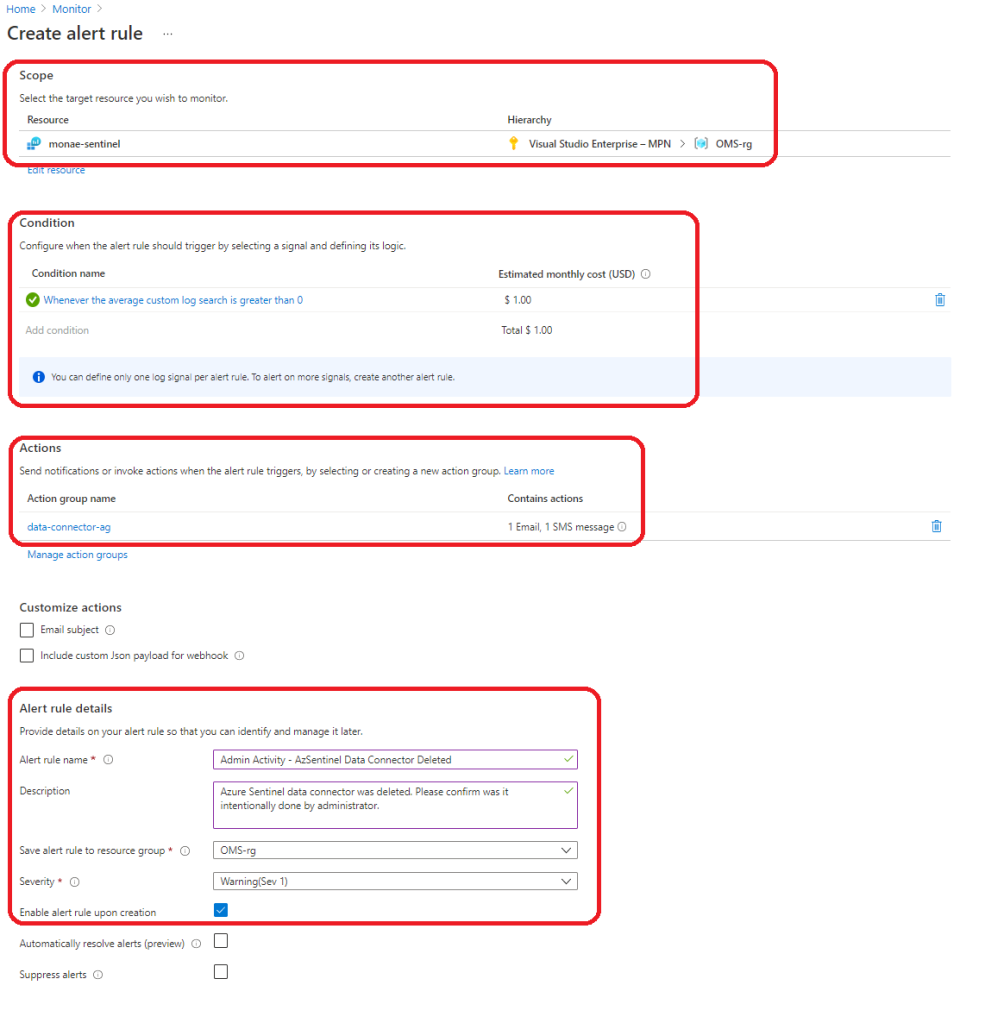
Alternative approach is to create monitoring rule to Azure Monitor alerts. I have seen this approach in scenarios where an organization doesn’t want to have platform monitoring alerts on the incident queue. Azure Monitor brings some extra costs to the table but is still cheap generally speaking.
First – go to the Azure Monitor Alerts and start creating new alert. Select signal type = all and “custom log search”.

Configure the following sections at minimum:
- Scope
- Condition – define query
- Actions – create action group
- Alert rule details
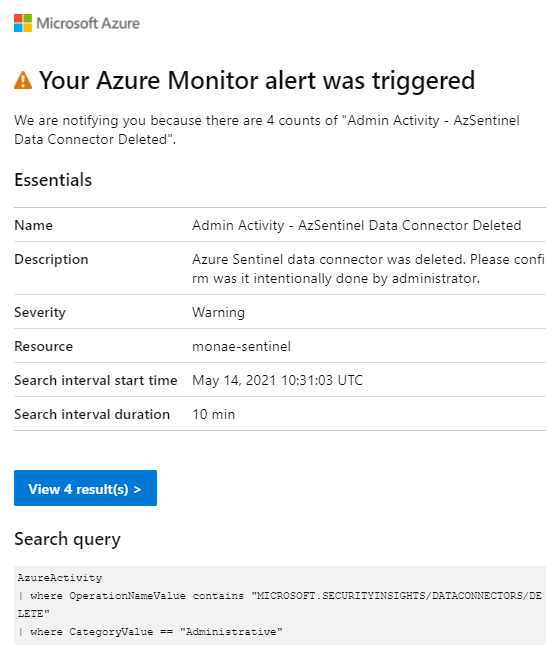
Alerts
Depending what solution you want to use differs what options there are available. Azure Sentinel offers normal incident investigation features and Azure Monitor basically notifications and actions such as Runbook, Azure Function, ITSM, Logic App, Secure Webhook & Webhook so there are plenty of options available.

How to Identify Which Data Connector was Deleted?
Azure Sentinel data connector configuration managed by ‘Microsoft.SecurityInsights provider (underneath of Microsoft.OperationalInsights provider), full id for Azure Security Center data connector below from my demo environment.
/subscriptions/a4bc2f71-043b-4383-8f8a-720a4cacc525/resourceGroups/fetaoms/providers/Microsoft.OperationalInsights/workspaces/feta/providers/Microsoft.SecurityInsights/dataConnectors/e486f818-df41-404c-9042-8b95ca77ff6bIf you are using PowerShell it supports only the following data connectors:
- Azure Active Directory Identity Protection
- Azure Advanced Threat Protection (MDI)
- Azure Security Center
- Amazon Web Services CloudTrail
- Microsoft Cloud App Security
- Microsoft Defender Advanced Threat Protection
- Threat Intelligence data
If someone deletes one of those data connectors it can easily seen by comparing data (VS Code) that has been taken out before/after the delete activity.

I tested to take data connectors out with REST API (management.azure.com) endpoint and received exactly same results, PS uses the same endpoint. The tricky part is how you can identity which data connector was deleted if it is not one of the supported list.

If you suspect problems with other data connectors than supported ones you can use ‘Data Collection Health Monitoring’ or ‘Workspace Usage Report’ workbooks. The first one has for example “Last event received” and the second one “Last Record Created” in the workspace info tab. Another approach would be to use KQL magic and create alert (Azure Monitor / Sentinel) if data has not been ingested to the specific table.


Summary
Monitoring SIEM solution data connectors could be painful task to do and there isn’t a silver bullet for it, at least for now. Data connectors are, in many organization whom I work with, maintained by different team. This might lead to scenario where operational teams doesn’t want to use Azure Sentinel incident queue for alerting. In such scenario, Azure Monitor offers platform for integration. Azure Monitor, Azure Sentinel, KQL and MCAS offers ways to build monitoring at the time of writing but definitely there are some gray areas to cover. Hopefully these are tackled soon!
References
Data Connectors – REST API (Azure Sentinel) | Microsoft Docs
Get-AzSentinelDataConnector (Az.SecurityInsights) | Microsoft Docs
Az.SecurityInsights Module | Microsoft Docs
Workspace Usage workbook – KQLpublic/KQL/Workbooks/WorkspaceUsage at master · CliveW-MSFT/KQLpublic (github.com)
Monitor Data Connector Health workbook – Monitor the health of your data connectors with this Azure Sentinel workbook | Microsoft Docs

FYI – It looks like there is an extra “AzureActivity” in this KQL query:
AzureActivity
|AzureActivity
| where OperationNameValue contains “MICROSOFT.SECURITYINSIGHTS/DATACONNECTORS/DELETE”
| where CategoryValue == “Administrative”
It’s now updated. It was my bad, sorry for the typo.
Hi Sami,
when I am trying to populate all the datatypes/datasets of the connector. It is not getting populated as it is time frame dependent. So, I am unable to know which datatype is missing if there is no logs generated in that particular time frame. Moreover, if someone don’t know how many datatypes have been integrated then its very difficult to know which data type is not receiving logs as many device vendors logs can be configured under common security logs or syslog datatypes . I need your valuable suggestions on these two pointers ;
1. Please help me how I can populate all the datatype irrespective of time frame .
2. I am unable to fetch corresponding connector name to which datatypes are associated through KQL. I am using below query to fetch last log status of data connectors :
union withsource=TableName1 *
| where TimeGenerated > ago(2d)
| project TimeGenerated, TableName1, DeviceVendor,ProviderName
| summarize last_log = datetime_diff(“second”, now(), max(TimeGenerated)),last_event_received = max(TimeGenerated) by TableName1, DeviceVendor,ProviderName
| project [‘Table Name’] = TableName1, [‘Latest Record Created’] = last_log, [‘Time’] = last_event_received, DeviceVendor, ProviderName
Have you raised these issues with the product team. Seems like the gaps in the monitoring API should be straightforward to fix.
Hi Dean, actually I haven’t but it’s good idea. I will contact Sentinel PG about the topic.