
In the last year, I wrote how to Monitor Microsoft Sentinel data connectors’ health by leveraging native Microsoft solutions. This blog post is an updated version of the initial one.
The data connector health is one of the core functions in any SIEM solution and in the raise of cloud-based solutions often overlooked. At the same time, it’s a complex task from a technical perspective and its relation to organization structure and different teams’ responsibilities. I’m quite often in discussions about the topic and lately, I have seen a few cases where has been a significant increase in data ingestion (compared to baseline) into Sentinel which are the main reasons I wrote this blog post.
The purpose of this blog post is to share technical options on how monitoring can be established. I’m emphasizing that this blog concentrates only on the technical side, but there are processes and responsibilities heavily involved in this topic. There are different approaches (depending on the tool stack) and I’m scoping the blog to the following ones:
- Leverage the ‘Data Collection Health’ workbook
- Leverage the ‘SentinelHealth’ data table
- Using Playbooks to automate data ingestion anomaly monitoring
- Custom alert rules for monitoring
- In scenarios where data connector is not supported by SentinelHealth table or playbook solution doesn’t provide necessary information
Azure Workbooks
Workbooks are a great tool for visualizing the collected data from different data sources. Out of the box, Microsoft sentinel has two (2) workbooks that provide insights from a data ingestion point of view. These can be deployed easily from the gallery templates and are:
Workbook – Data Collection Health
Data Collection Health workbook provides insights into underlying data tables in Azure Log Analytics. If you are familiar with the Azure Log Analytics schema and content of the data tables this workbook can provide valuable insight. The downside is that the workbook provides a snapshot of the Log Analytics status and it cannot be used efficiently for continuous health monitoring.
The Overview tab shows the general status of data ingestion in the selected workspace: baseline, EPS rates, and time the last event/log has been received.
I have used the overview tab for confirming information such as:
- Table size
- Table entries
- The last event received per data table
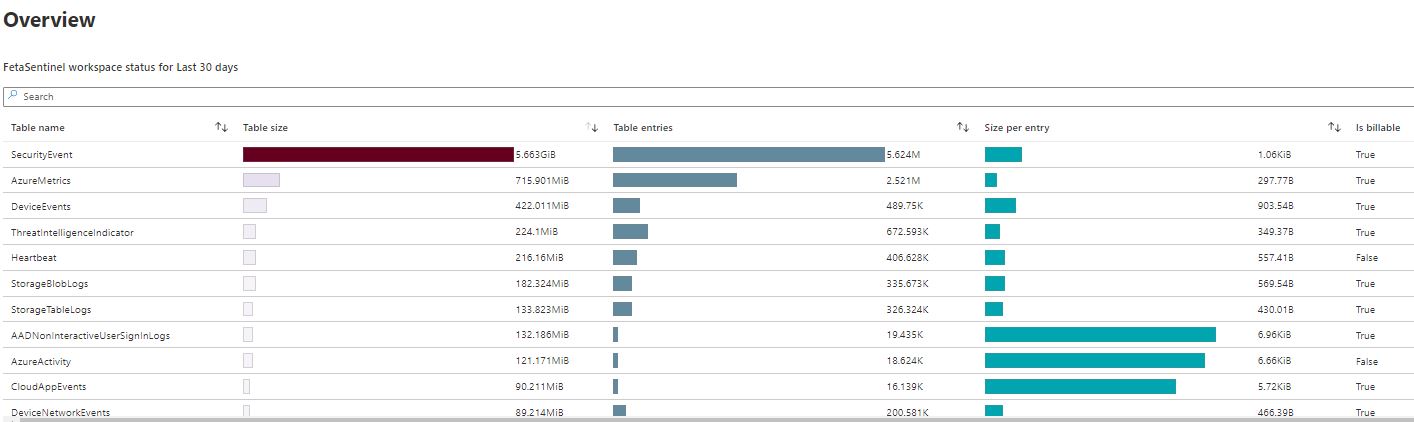
From the bottom of the workbook, you can find valuable ‘last event received’ information per table.

Other blades on the same workbook have anomaly information referring to the ingestion baseline. These queries provide a good starting point for creating your own custom queries which can be used in alert rules (Azure Monitor / Sentinel). To modify the query by your needs here is reference KQL for finding the last event received per the Log Analytics table.
When to use
When you want to identify the overall situation of the Log Analytics workspace and evaluate when the latest data entry has been saved to the Log Analytics tables. Also, data collection anomalies and agent info contain valuable information from the data collection process and virtual machine availability which can be used to detect possible changes in the data ingestion baseline.
Workbook – Workspace Usage
This workbook contains some overlapping information about the table but has richer information in some areas. The last three (3) columns contain very useful information from the data connector monitoring point of view. The workbook has a bunch of other queries that I’m not going to cover here but I encourage you to test it yourself. The ‘Last Record Received’ is something that can be used to build KQL queries and create alerts.
When to Use
The workbook has lots of information from the workspace activity such as detailed information about the tables, latencies, cost analysis, and ‘Microsoft Sentinel’ related data types & other relevant information. An extremely valuable workbook that can be used for analyzing Azure Sentinel & Log Analytics workspace status.
Data Ingestion Anomaly Playbook
By leveraging the data provided by the ‘Data Collection Health’ workbook we can send (email/Teams message) user-defined anomaly scores.
The Data collection anomalies help to detect anomalies in the data collection process, by table and data source. The anomalies are calculated using the series_decompose_anomalies() function that returns an anomaly score.
The Playbook
Data ingestion anomaly playbook sends anomaly information by email and to the Teams channel.


More information about the Playbook is on the Microsoft TechCommunity blog and the source code is found in the GitHub repo.
In the pictures you can find example outputs sent to the Teams channel & by Email:


I did a slightly modified version of the playbook that doesn’t include Virtual Machine Heartbeats. Why? Because there is a better solution available:) If you would like to have information on how different agents on Virtual Machines (Azure/on-prem/multi-cloud) are reporting to security solutions I encourage you to take a look at this workbook made by my colleague Markus Pitkäranta.
The purpose of the workbook is to display information about various agents related to effective security monitoring on IaaS workloads (both ARC servers and virtual machines so a multi-cloud scenario is supported). The source code for this awesome workbook is found in Markus’s GitHub repo.

SentinelHealth Data Table
The newest addition to data connectors’ monitoring capabilities is the ‘SentinelHealth’ data table. The table contains status information from Sentinel data connectors, but only a fraction of them. Currently, the supported data connectors are (based on the documentation):
- Amazon Web Services (CloudTrail and S3)
- Dynamics 365
- Office 365
- Office ATP
- Threat Intelligence – TAXII
- Threat Intelligence Platforms
Below is an example list from my own demo environment.
SentinelHealth
|where SentinelResourceType contains "Data connector"
| summarize by SentinelResourceName
When looking at the list above it’s evident that there isn’t a silver bullet that tackles all data connectors in terms of operational monitoring.
Another aspect is that monitoring Sentinel data connectors, in many organizations I work with, is the responsibility of the infrastructure team.
This might lead to a scenario where the infrastructure team doesn’t want to use (or is not allowed to use) the Sentinel incident queue for alerting when data connectors are down. In such a scenario, Azure Monitor offers a platform for integration. Azure Monitor, Microsoft Sentinel, KQL, and Defender for Cloud Apps (MDA) provide ways to build monitoring at the time of writing but definitely, there are some gray areas to cover.
Example KQL for creating an alert when the supported data connector status is failed. More example rules in the official documentation (docs.microsoft.com).
//Last failure status
SentinelHealth
| where TimeGenerated > ago(1d)
| where OperationName == 'Data fetch status change'
| where Status in ('Success', 'Failure')
| summarize TimeGenerated = arg_max(TimeGenerated,*) by SentinelResourceName, SentinelResourceId
| where Status == 'Failure'
Newest Addition – Defender for Cloud Apps?
During the investigation, I found “MicrosoftCloudAppSecurity” aka ‘Defender for Cloud Apps (MDA)’ as a data connector underneath Sentinel API. This would be an interesting addition to the current setup and most probably other XDR solutions would be added quite soon to the supported list. Currently, the MDA data connector status is not found in the SentinelHealth data table.
Through API
Calling API where we can see the whole list of data connectors and details from the MDA connector. All data connectors and those settings are found underneath ‘Microsoft.SecurityInsights/dataconnectors’ provider.
https://management.azure.com//subscriptions/<insert sub id>/resourceGroups/<Sentinel resource group>/providers/Microsoft.OperationalInsights/workspaces/<Sentinel instance name>/providers/Microsoft.SecurityInsights/dataConnectors?api-version=2020-01-01"

Through PowerShell
The same data connector data is reachable also with PowerShell Sentinel cmdlet.
Get-AzSentinelDataConnector -ResourceGroupName 'ms-sentinel-rg' -WorkspaceName 'FetaSentinel' | fl Name,Kind,DataTypes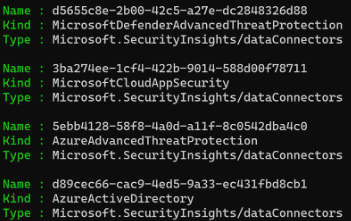
Custom Alert Rules – KQL
In general, native Microsoft data connectors (service-to-service integrations) are reliable, and errors are rarely seen. It doesn’t mean that those shouldn’t be monitored but I would rely on the playbook mentioned above which provides anomaly information on a daily basis to the Teams channel or by Email, depending on how you would like to have it.
When I’ve seen hiccups with native MS connectors those have been mostly on the backend. One example is a connection between Defender for Cloud Apps (MDA) & Office 365. Thresholds are something that needs to be taken into account when planning data connectors’ monitoring. There might be significant differences between the data connectors on how much data is flowing in, and what’s the frequency.
If there is a data connector you would like to monitor, it isn’t supported by the SentinelHealth table or the playbook mentioned above is not good enough KQL is the key. With KQL, the ‘last event received will be the game changer. I’ve created some example queries (kudos to Markus) which you can find in my GitHub repository.
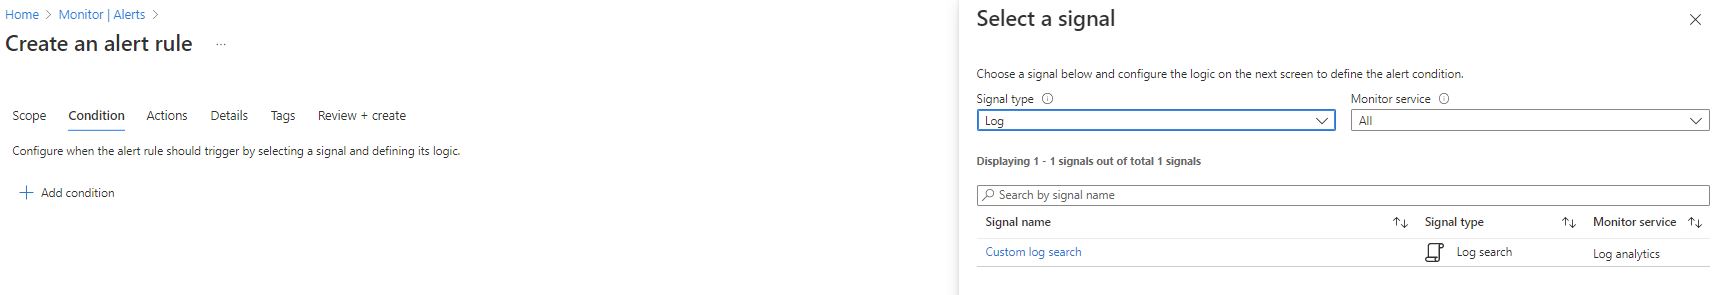
Create Example Alert in Azure Monitor
I have seen this approach as useful in scenarios where an organization doesn’t want to have health monitoring alerts on the Sentinel incident queue. Azure Monitor brings some extra costs to the table but is still cheap generally speaking.
Navigate to the Azure Monitor Alerts and start by creating a new alert. Select signal type = all and “custom log search” and insert KQL and actions to be done (sms/email/webhook) when alert is created.


Example use cases
During the last case I worked with I created a few KQL queries for monitoring purposes for the following example cases:
- Monitoring Palo Alto data source ingestion based on the last event received to CommonSecurityLog per product
- Monitoring DnsEvents & DnsIventory data ingestion
let alertInterval = 24h;
DnsEvents
| where TimeGenerated > ago(alertInterval)
| take 1
| summarize Healthy = count()
| project LogType = "DnsEvents", Healthy
| union isfuzzy=true
(DnsInventory
| where TimeGenerated > ago(alertInterval)
| take 1
| summarize Healthy = count()
| project LogType = "DnsInventory", Healthy)
| where Healthy == 1
Considerations
It depends heavily on the environment architecture and Microsoft Sentinel data connector and what data ingestion feeds you need to monitor. But at the same time, monitoring data connectors is an important but not straightforward task to establish. To summarize, the following tools might be useful in the monitoring journey:
- Azure Workbooks
- Playbook for sending data collection anomalies to the responsible team
- Customized version
- SentinelHealth data table for dedicated connectors
- Custom alert rules for monitoring based on KQL
In this blog, I’ve shown different possibilities to take the Sentinel data connector health on control. One alternative approach is to send monitoring data through Teams or Logic Apps to the responsible team. This is very well elaborated in Jeffrey’s blog (Monitor Microsoft Sentinel Data Connector using Health Monitoring and Logic App).
References
Monitor the health of your Microsoft Sentinel Data Connectors
Monitor Microsoft Sentinel Data Connectors Health
Monitor Microsoft Sentinel Data Connectors using Health Monitoring and Logic App
